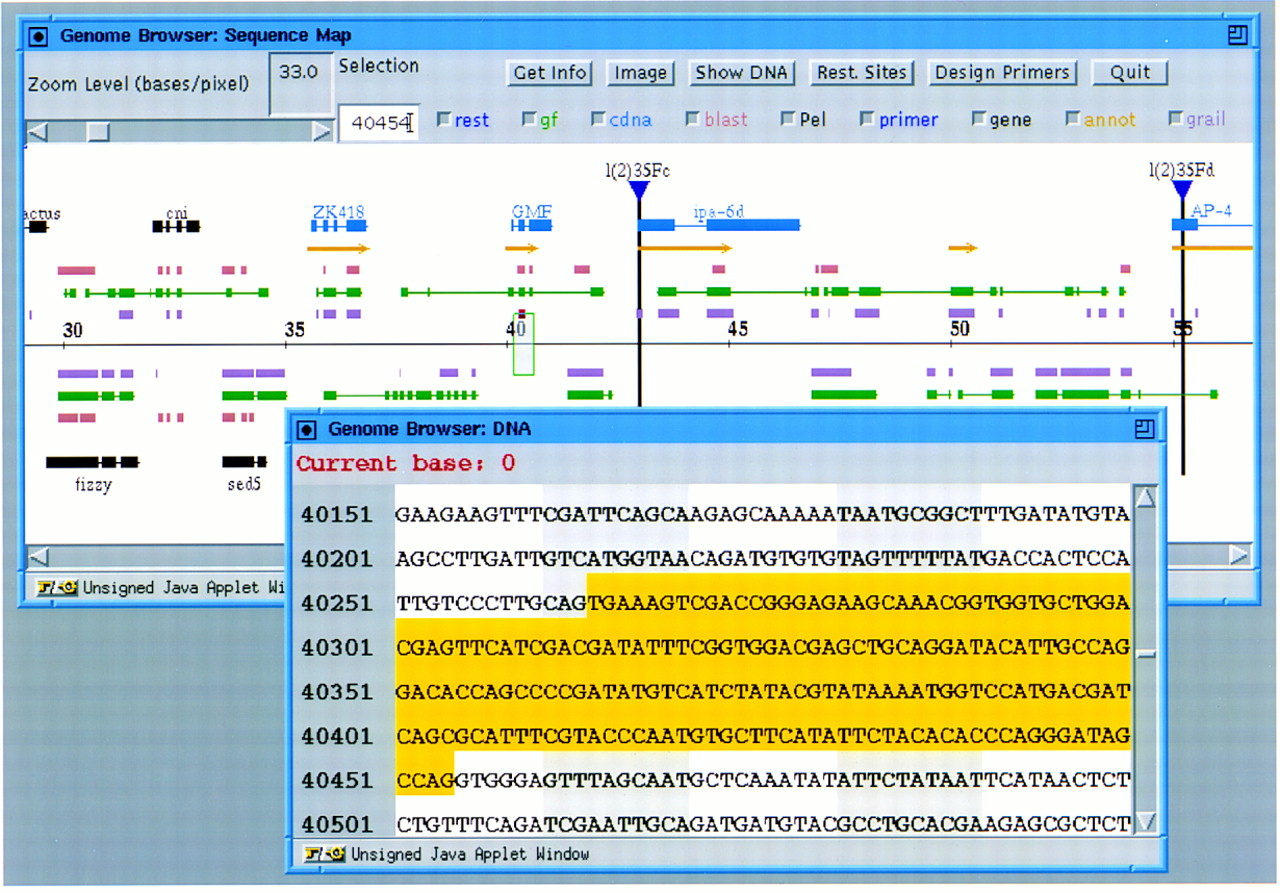
Figure 3 DNA view. The user has increased the level of zoom in the sequence map display so that a 30-kb, rather than 80-kb, region of the P1 is shown. The user has then selected a short region over the 40-kb mark on the central horizontal axis of the sequence map display, and has pressed the Show DNA button at the top of the browser window. Both the sequence data and the code for the sequence display viewer are dynamically loaded only as needed. Once the DNA view appears, a "shadow" representing its span along the sequence map appears as a gray box outlined in green on the horizontal axis. The user has selected an exon (predicted by Drosophila GRAIL) within the sequence map, resulting in this feature being highlighted in red in the sequence view and in yellow in the DNA view. The DNA view can be resized, and the DNA viewer deals with resizing intelligently by ensuring that rows are always displayed as multiples of ten. To further provide positional cues, two slightly different background colors are used for adjacent 10-base columns.